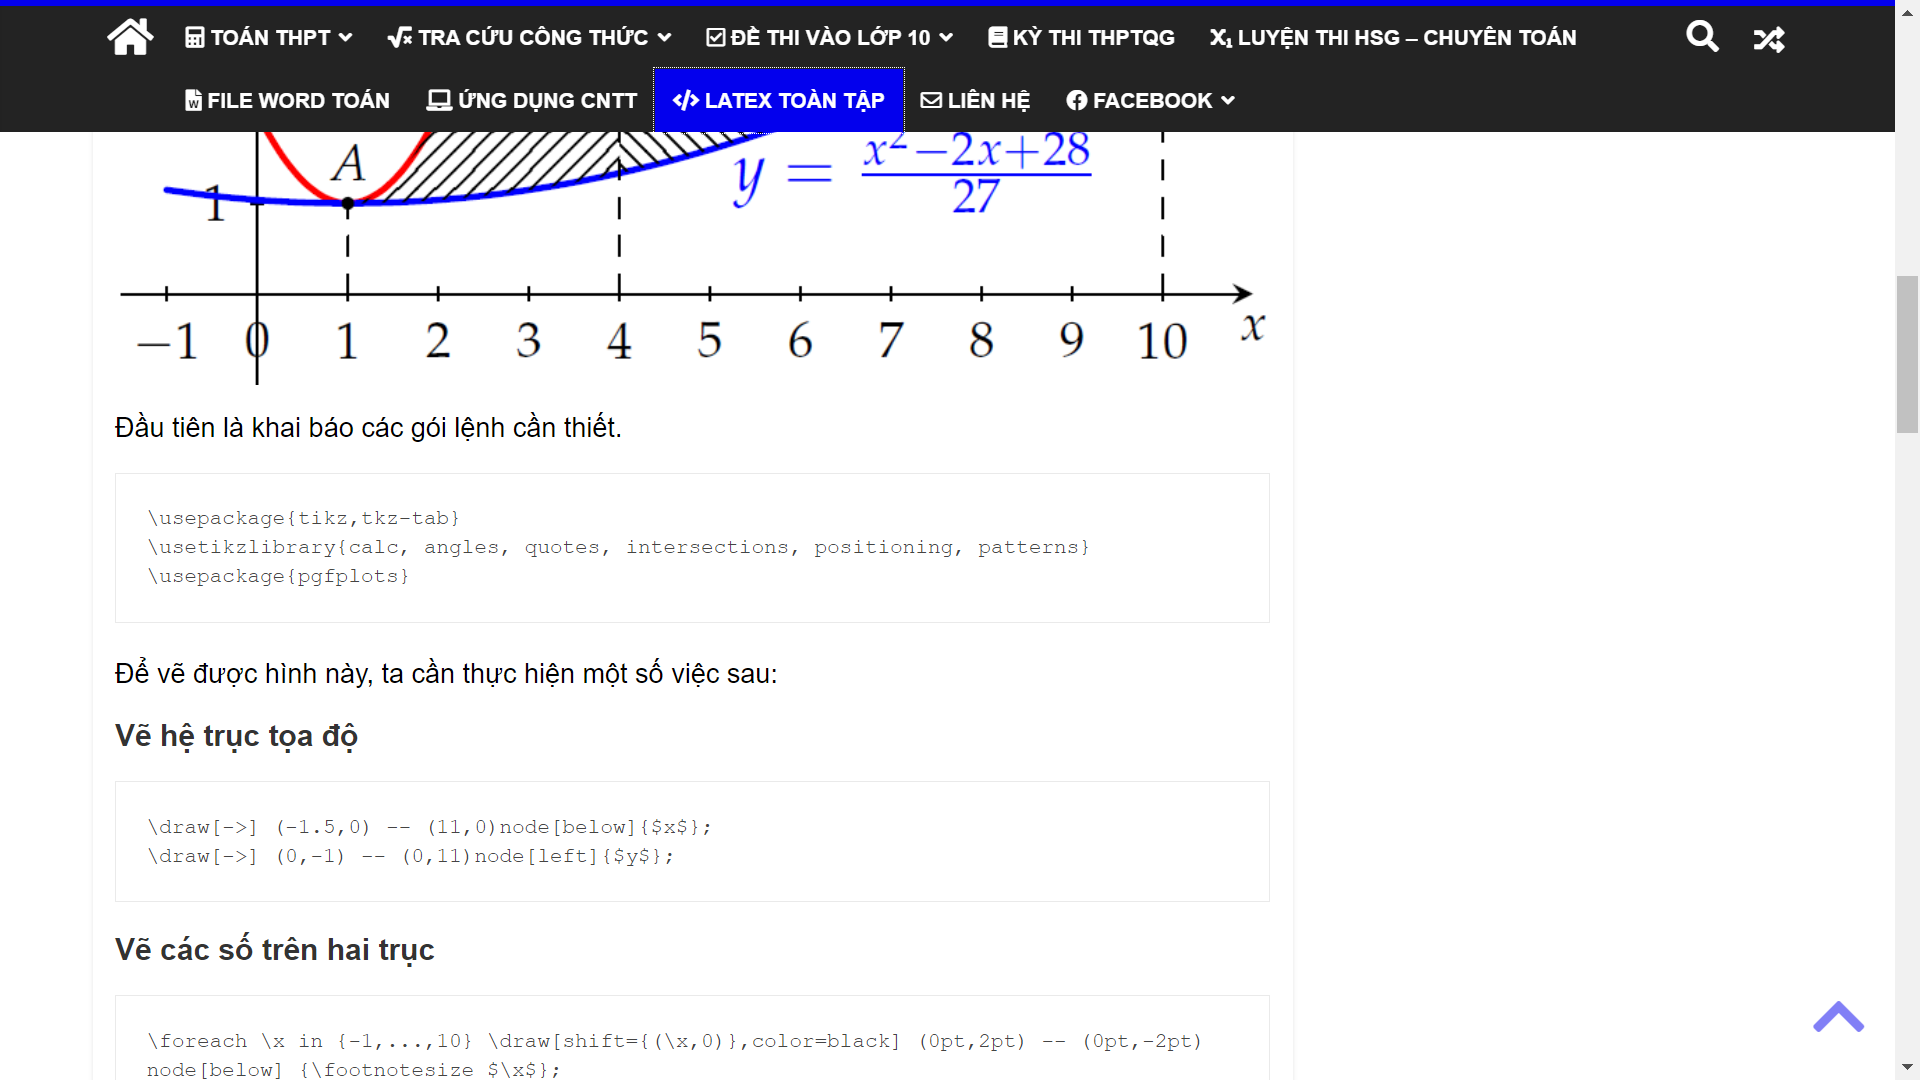
Đầu tiên là khai báo các gói lệnh cần thiết.
\usepackage{tikz,tkz-tab}
\usetikzlibrary{calc, angles, quotes, intersections, positioning, patterns}
\usepackage{pgfplots}
Để vẽ được hình này, ta cần thực hiện một số việc sau:
Vẽ hệ trục tọa độ
\draw[->] (-1.5,0) -- (11,0)node[below]{$x$};
\draw[->] (0,-1) -- (0,11)node[left]{$y$};
Vẽ các số trên hai trục
\foreach \x in {-1,...,10} \draw[shift={(\x,0)},color=black] (0pt,2pt) -- (0pt,-2pt) node[below] {\footnotesize $\x$};
\foreach \y in {1,...,10} \draw[shift={(0,\y)},color=black] (2pt,0pt) -- (-2pt,0pt) node[left] {\footnotesize $\y$};
Vẽ đồ thị từng hàm số
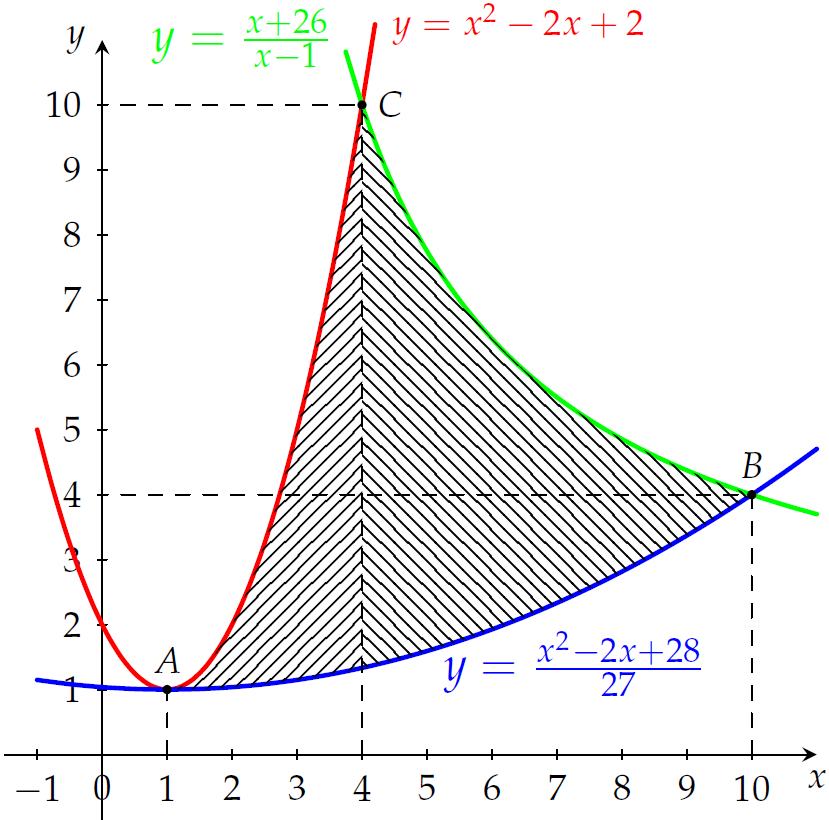
\draw[line width=1.0pt,color=red,smooth,domain=-1:4.2] plot(\x,{(\x-1)^2+1}) node[right]{$y=x^2-2x+2$};
\draw[line width=1.0pt,color=blue,smooth,domain=-1:11] plot(\x,{(\x-1)^2/27+1});
\draw[line width=1.0pt,color=green,smooth,domain=3.75:11] plot(\x,{27/(\x-1)+1});
Vẽ miền giới hạn của từng cặp đồ thị
\fill[pattern=north east lines]plot[domain=1:4](\x,{(\x-1)^2+1})--plot[domain=4:1](\x,{(\x-1)^2/27+1})--cycle;
\fill[pattern=north west lines]plot[domain=4:10](\x,{(\x-1)^2/27+1})--plot[domain=10:4](\x,{27/(\x-1)+1})--cycle;
Ngoài ra, ta còn phải vẽ thêm một số điểm, chú thích… cho đầy đủ, rõ ràng. Dưới đây là code đầy đủ, chúc các bạn thành công.
\begin{tikzpicture}[scale=0.5, font=\footnotesize, line join=round, line cap=round, >=stealth]
	\draw[->] (-1.5,0) -- (11,0)node[below]{$x$};
	\draw[->] (0,-1) -- (0,11)node[left]{$y$};

	\foreach \x in {-1,...,10} \draw[shift={(\x,0)},color=black] (0pt,2pt) -- (0pt,-2pt) node[below] {\footnotesize $\x$};
	\foreach \y in {1,...,10} \draw[shift={(0,\y)},color=black] (2pt,0pt) -- (-2pt,0pt) node[left] {\footnotesize $\y$};

	\draw[line width=1.0pt,color=red,smooth,domain=-1:4.2] plot(\x,{(\x-1)^2+1}) node[right]{$y=x^2-2x+2$};
	\draw[line width=1.0pt,color=blue,smooth,domain=-1:11] plot(\x,{(\x-1)^2/27+1});
	\draw[line width=1.0pt,color=green,smooth,domain=3.75:11] plot(\x,{27/(\x-1)+1});

	\fill[pattern=north east lines]plot[domain=1:4](\x,{(\x-1)^2+1})--plot[domain=4:1](\x,{(\x-1)^2/27+1})--cycle;
	\fill[pattern=north west lines]plot[domain=4:10](\x,{(\x-1)^2/27+1})--plot[domain=10:4](\x,{27/(\x-1)+1})--cycle;

	\node[right, color=blue] at (5,0.8){$y=\frac{x^2-2x+28}{27}$}
	\node[left, color=green] at (3.8,11){$y=\frac{x+26}{x-1}$}

	\fill (1,1) circle (2pt) node[above]{$A$};
	\fill (10,4) circle (2pt) node[above]{$B$};
	\fill (4,10) circle (2pt) node[right]{$C$};

	\draw[dashed] (1,0)--(1,1);
	\draw[dashed] (4,0)--(4,10)--(0,10);
	\draw[dashed] (10,0)--(10,4)--(0,4);
\end{tikzpicture}
Lưu ý: Có ai đó đã copy nguyên xi bài viết cá nhân của mình mà không chịu ghi nguồn. Buồn lắm luôn!
https://tulieutoanhoc.com/tikz-hinh-phang-gioi-han-boi-3-do-thi/