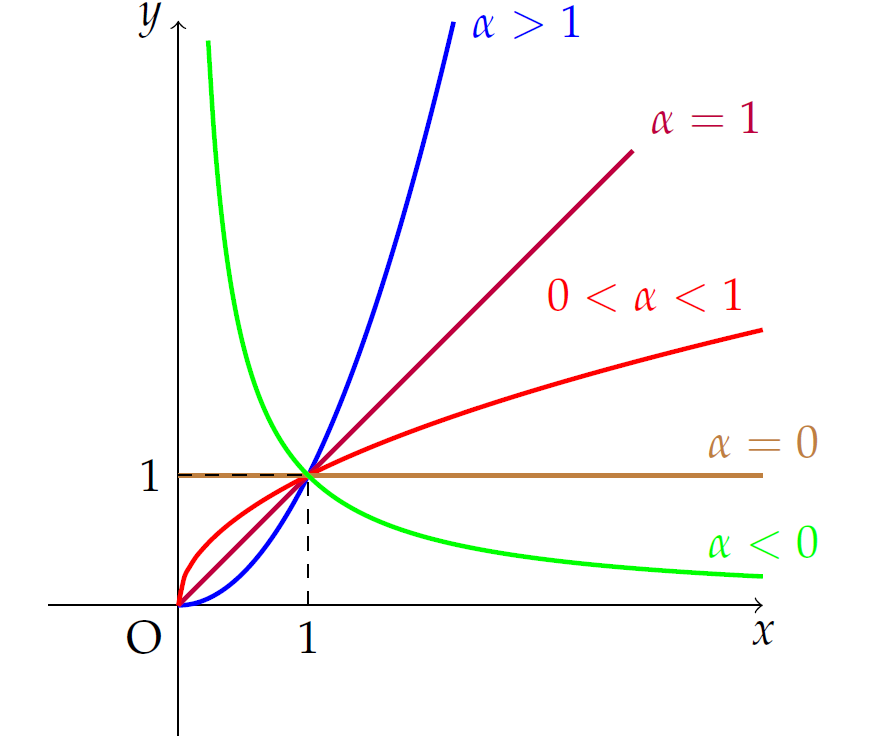
Nhân tiện đang làm tài liệu hỗ trợ học sinh ôn tập về hàm số lũy thừa, tôi có vẽ một hình tổng hợp đồ thị của hàm số lũy thừa trong các trường hợp bằng Tikz trong LaTeX. Xin chia sẻ với mọi người đoạn code để sử dụng.
\begin{tikzpicture}
	\draw[->] (-1,0)--(0,0) node[below left]{O}--(4.5,0) node[below]{$x$};
	\draw[->] (0,-1)--(0,4.5) node[left]{$y$};
	\draw[smooth, blue, line width=1,samples=100] plot[domain=0:2.12] (\x,{\x^2}) node[right]{$\alpha>1$};
	\draw[purple, line width=1] (0,0)--(3.5,3.5) node[above right]{$\alpha=1$};
	\draw[smooth, red, line width=1,samples=100] plot[domain=0:4.5] (\x,{\x^(1/2)}) node[above left]{$0<\alpha<1$};
	\draw[brown, line width=1] (0,1)--(4.5,1) node[above]{$\alpha=0$};
	\draw[smooth, green, line width=1,samples=100] plot[domain=0.23:4.5] (\x,{1/\x}) node[above]{$\alpha<0$};
	\draw[dashed] (1,0) node[below]{$1$}--(1,1)--(0,1) node[left]{$1$};
\end{tikzpicture}