Việc vẽ đồ thị của hàm số logarit bằng Tikz có đôi chút khó khăn, phải tùy cơ mà ứng biến. Nhân đây, tôi xin chia sẻ đoạn code mà tôi đã thực hiện được, chúc các bạn thành công!
\begin{tikzpicture}
\draw[->] (-1,0)--(0,0) node[below left]{O}--(5,0) node[below]{$x$};
\draw[->] (0,-4)--(0,4) node[below left]{$y$};
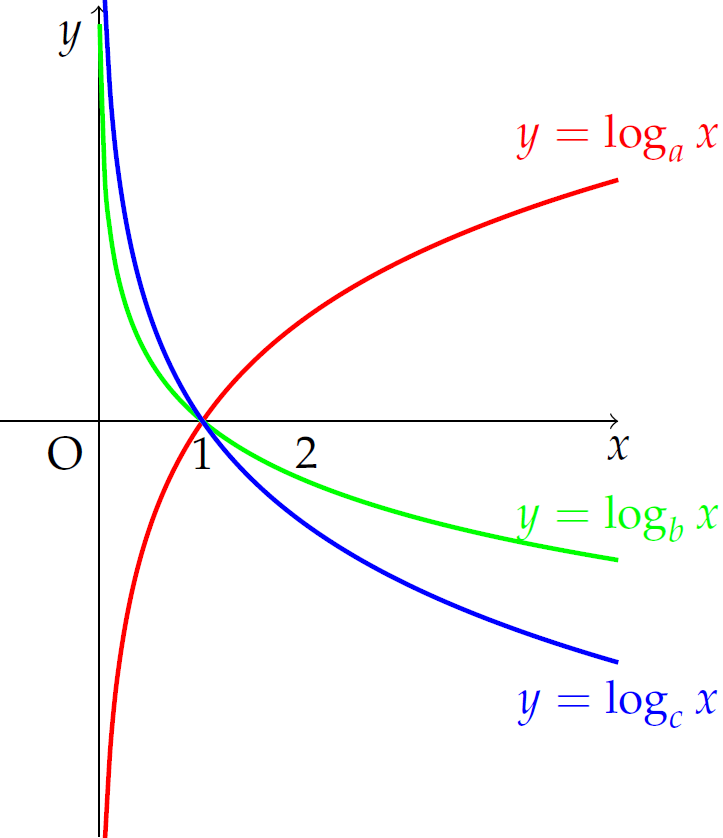
\draw[smooth, red, line width=1,samples=100] plot[domain=0.06:5] (\x,{log2(\x)}) node[above]{$y=\log_ax$};
\draw[smooth, green, line width=1,samples=100] plot[domain=0.01:5] (\x,{ln(\x)/ln(0.3)}) node[above]{$y=\log_bx$};
\draw[smooth, blue, line width=1,samples=100] plot[domain=0.06:5] (\x,{ln(\x)/ln(0.5)}) node[below]{$y=\log_cx$};
\draw[dashed] (1,0) node[below]{$1$} (2,0) node[below]{$2$};
\end{tikzpicture}